Category:CC-BY-3.0-IGO
Jump to navigation
Jump to search
copyright license | |||||
| Upload media | |||||
| Instance of |
| ||||
|---|---|---|---|---|---|
| Edition or translation of | |||||
| Author | |||||
| Full work available at URL | |||||
| official website | |||||
| |||||
This category is for media licensed under the Creative Commons Attribution 3.0 License: http://creativecommons.org/licenses/by/3.0/igo.
Media in category "CC-BY-3.0-IGO"
The following 200 files are in this category, out of 398 total.
(previous page) (next page)-
1.Total applications and growth in applications 2016.png 5,651 × 4,099; 154 KB
-
1.Total applications and growth in applications.png 5,918 × 4,539; 177 KB
-
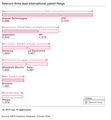
10.PCT top 10 applicants, 2016.png 5,517 × 5,987; 197 KB
-
10.PCT top 10 applicants.png 5,839 × 5,586; 187 KB
-
11.Utility model applications for the top 10 offices, 2016.png 5,383 × 6,622; 403 KB
-
11.Utility model applications for the top 10 offices.png 5,942 × 5,579; 197 KB
-
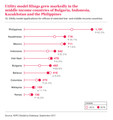
12.Utility model applications for offices of selected middle-income countries.png 5,682 × 6,031; 223 KB
-
13.Total trademark application class counts, 2016.png 5,353 × 3,987; 150 KB
-
13.Total trademark application class counts.png 5,680 × 3,979; 157 KB
-
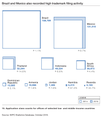
14.Application class counts for the top 10 offices, 2016.png 5,368 × 7,062; 288 KB
-
14.Application class counts for the top 10 offices.png 5,768 × 6,088; 220 KB
-
15.Application class counts for offices of selected middle-income countries.png 5,622 × 5,797; 216 KB
-
16.Resident trademark application class count relative to GDP for selected origins.png 5,811 × 5,724; 197 KB
-
17.The top three industry sectors for each of the top five offices, 2016.png 5,450 × 5,607; 243 KB
-
17.The top three industry sectors for each of the top five origins.png 5,656 × 5,891; 246 KB
-
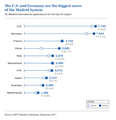
18.Madrid international applications for the top 10 origins, 2016.png 5,435 × 5,808; 216 KB
-
18.Madrid international applications for the top 10 origins.png 5,708 × 5,909; 209 KB
-
180821 ki elisabete weiderpass vainio 0056 01.jpg 3,489 × 5,233; 8.29 MB
-
180821 ki elisabete weiderpass vainio 0056 02.tif 3,489 × 5,233; 52.28 MB
-
19.Madrid System top 10 applicants, 2016.png 5,539 × 6,398; 234 KB
-
19.Madrid System top 10 applicants.png 5,752 × 6,624; 215 KB
-
2.Shares of IP filing activity by region 2016.png 5,539 × 7,488; 298 KB
-
2.Shares of IP filing activity by region.png 5,608 × 7,397; 281 KB
-
20.Total application design counts, 2016.png 5,435 × 4,069; 149 KB
-
20.Total application design counts.png 6,031 × 4,085; 168 KB
-
2022全球人口規模和年成長率圖.jpg 2,126 × 1,451; 441 KB
-
21.Application design counts for the top 10 offices, 2016.png 5,502 × 6,592; 205 KB
-
21.Application design counts for the top 10 offices.png 5,952 × 6,336; 229 KB
-
22.Application design counts for offices of selected middle-income countries.png 5,682 × 5,900; 217 KB
-
23.Resident application design count relative to GDP for selected origins, 2016.png 5,353 × 4,800; 151 KB
-
23.Resident application design count relative to GDP for selected origins.png 5,909 × 5,446; 184 KB
-
24.The top three industry sectors for selected offices, 2016.png 5,704 × 4,987; 231 KB
-
24.The top three industry sectors for selected origins.png 5,760 × 6,371; 256 KB
-
25.Designs in Hague international applications for the top 10 origins, 2016.png 5,412 × 6,584; 312 KB
-
25.Designs in Hague international applications for the top 10 origins.png 5,734 × 5,839; 219 KB
-
26.Hague System top 10 applicants based on design count, 2016.png 5,517 × 6,353; 193 KB
-
26.Hague System top 10 applicants based on design count.png 5,815 × 6,917; 229 KB
-
3.IP rights in force 2016.png 5,554 × 3,725; 126 KB
-
3.IP rights in force.png 5,734 × 3,736; 132 KB
-
4.Total patent applications 2016.png 5,427 × 3,710; 137 KB
-
4.Total patent applications.png 5,622 × 3,870; 144 KB
-
5.Patent applications for the top 10 offices 2016.png 5,383 × 6,808; 260 KB
-
5.Patent applications for the top 10 offices.png 5,717 × 5,731; 207 KB
-
6.Patent applications for offices of selected low- and middle-income countries 2016.png 5,412 × 6,749; 316 KB
-
6.Patent applications for offices of selected middle-income countries.png 5,813 × 5,891; 215 KB
-
7.Resident patent applications relative to GDP for the top origins 2016.png 5,330 × 4,278; 131 KB
-
7.Resident patent applications relative to GDP for the top origins.png 5,702 × 5,477; 174 KB
-
8.The top three technology fields for each of the top five offices, 2012-14, 2016.png 5,442 × 5,495; 242 KB
-
8.The top three technology fields for each of the top five origins, 2013-15.png 5,778 × 7,122; 283 KB
-
9.PCT international applications for the top 10 origins, 2016.png 5,398 × 6,868; 287 KB
-
9.PCT international applications for the top 10 origins.png 5,656 × 5,874; 207 KB
-
Actual inundation areas were much larger than predicted.jpg 1,910 × 1,457; 765 KB
-
Actual versus predicted tsunami height MLIT.jpg 2,396 × 1,356; 636 KB
-
Alexander Gerst’s Earth timelapses (2017 reissue).webm 5 min 58 s, 3,840 × 2,160; 1.09 GB
-
An example of a tsunami hazard map Miyako City Iwate Prefecture.jpg 1,704 × 907; 198 KB
-
Ayilo 2 refugee settlement map as of 26 May 2017.pdf 4,964 × 3,506; 1.86 MB
-
Beagle-2-separation.png 640 × 480; 420 KB
-
Boroli Refugee settlement map.png 700 × 495; 138 KB
-
Countermeasures against level 1 and level 2 tsunamis.jpg 1,740 × 625; 115 KB
-
Crude death rates from 1950s with projections, Hong Kong.png 755 × 566; 146 KB
-
Crude death rates from 1950s with projections, Macao.png 755 × 566; 149 KB
-
Crude death rates from 1950s with projections, Singapore 01.png 755 × 566; 140 KB
-
Determining dike height MLIT.jpg 1,284 × 1,728; 522 KB
-
Dikes in Sendai before and after the tsunami of March 11 2011.jpg 2,277 × 1,414; 318 KB
















.png/120px-Aid_to_Basic_Education%2C_the_amount_of_bilateral_and_multilateral_aid_contributed_or_received_by_Vietnam_(2).png)


